House hunters
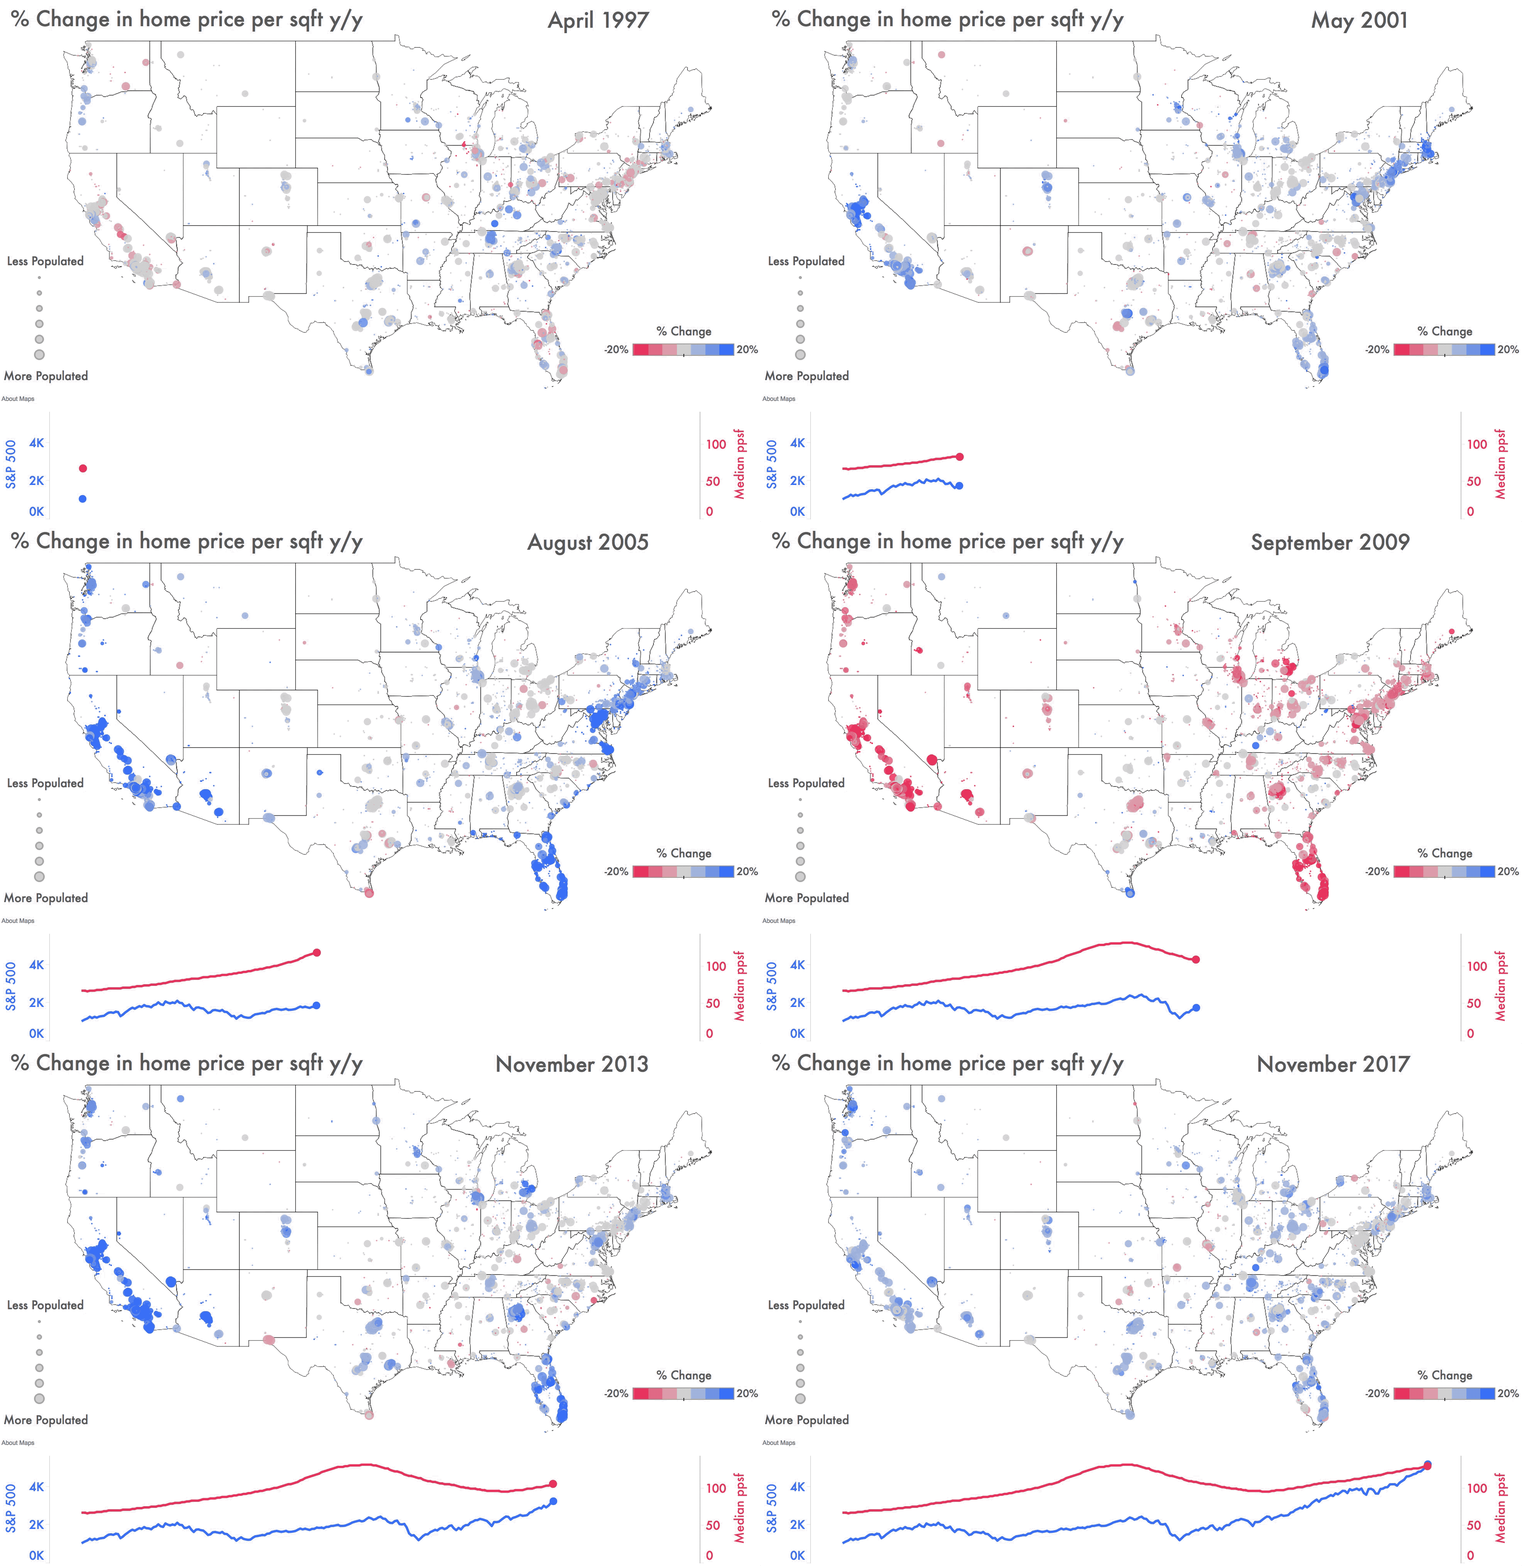
I recently stumbled upon some great housing data from zillow and decided to play around with it. I was interested to see how much home values have historically changed. With that, I started to put together a visualization that highlighted the year over year percent change in price per square foot (ppsf) by zip code (adjusted for inflation). The visualization also shows how the median ppsf compares to the S&P 500 during the same period. I used Tableau to create an animation of this progression over the last 20 years

Each bubble on the map is a specific zip code. These bubbles will be larger if they have a high population. For the percent change I compared the ppsf of a month to the previous year's ppsf of the same month. The bubble will be a darker green/blue (aqua?) if there is a high percentage increase and a darker red if there is a large percentage decrease. Finally, I added a scrolling line chart at the bottom to show the median ppsf in the US over time, as well as the S&P 500 as an index.
There were some cool insights that came about from this visualization. Most insights were releated to the decline in home values around 2008 due to the housing market crash. Specifically, when the housing crash started it took some time for other markets to be affected. The housing crisis starts around the summer of 2007, but the S&P 500 doesn't start its sharp decline until a year later.
It's also interesting to see where in the country the early signs of the housing crisis appeared. Most notably, we see a lot of red around the Midwest as early as 2006.
This visualization also helps highlight how home values tend to appreciate. Over this 20-year period many of the months show the map covered in green/blue (aqua? teal?). It is important to note that the housing crash left much room for growth, but the market could have leveled off or continued its decline. Instead, the housing market turned around realtively quickly and is now near its pre-crash levels.
All and all, it will be interesting to see what the next few years hold in store for the housing market. In the meantime I'm going to hop in a time machine and buy a house in 2012.